In our last post, we explored a range of powerful updates introduced to streamline the IP management experience with Triangle IP’s TIP Tool™. All thanks to valuable feedback from our users!
But there’s more to share. As promised, we’re excited to introduce an additional, exciting update to the Portfolio Manager within the TIP Tool™—a revamped Family Tree visualization known as the ‘Classic’ view.
Understanding the complex interconnections between patents and applications is crucial for strategic patent portfolio management across the globe. This latest update, meticulously crafted based on user feedback, aims to deliver more straightforward and familiar visual representations of these relationships.
Join us as we explore the transformative potential of this new ‘Classic’ view in the Family Tree and how it can elevate the way you manage your intellectual property portfolio.
The New ‘Classic’ Family Tree Visualization in the TIP Tool™
At Triangle IP, we thrive on user feedback. That’s why we’ve rolled out the Classic view for Family Tree visualization, tailored to meet the needs of seasoned IP professionals who want to decode the relationships between patents more quickly and efficiently.
User Requests That Shaped Our ‘Classic’ View
Here’s what was requested:
- Traditional Layout: Many of you asked for a genealogical layout reminiscent of classic family trees. This familiar format makes it easier to visualize patent lineage and relationships, catering especially to those used to conventional visualization.
- Clarity in Complex Relationships: While our Modern and Gantt chart viewing options excel at depicting timelines, many find it tough to grasp complex familial patent relationships quickly. The ‘Classic’ view addresses this need.
- User-Friendly Presentations: Many IP managers and legal professionals need to present patent families in a format that’s understandable to stakeholders who are not well-versed in patent timelines. The ‘Classic’ view of the patent family tree fits the bill perfectly.
- Integration of International and Sibling Applications: Users asked to have a clearer visualization of how international and related applications, like divisionals and continuations, integrate into the family tree, which was previously missing.
Get Both: Modern and Classic View of Family Tree
You may already be acquainted with our ‘Modern’ and ‘Gantt Chart’ style views within the ‘Portfolio Manager’ in the TIP ToolTM. We’re excited to introduce the ‘Classic’ view, which aims to make it easy for patent professionals to derive insights from global patent portfolios.
Here’s a comparison to showcase the benefits and features unique to the ‘Classic’ view:
#1. Genealogical Layout: Unlike the ‘Modern’ and ‘Gantt Chart’ styles, the ‘Classic’ view presents patent families in a traditional tree format, enhancing visualization clarity in understanding patent relationships.
Here are the visuals for all three:

‘Gantt Chart’ Visualization of Patent Family Tree in the TIP ToolTM

‘Modern’ Family Tree visualization of Patent Portfolios in the TIP ToolTM
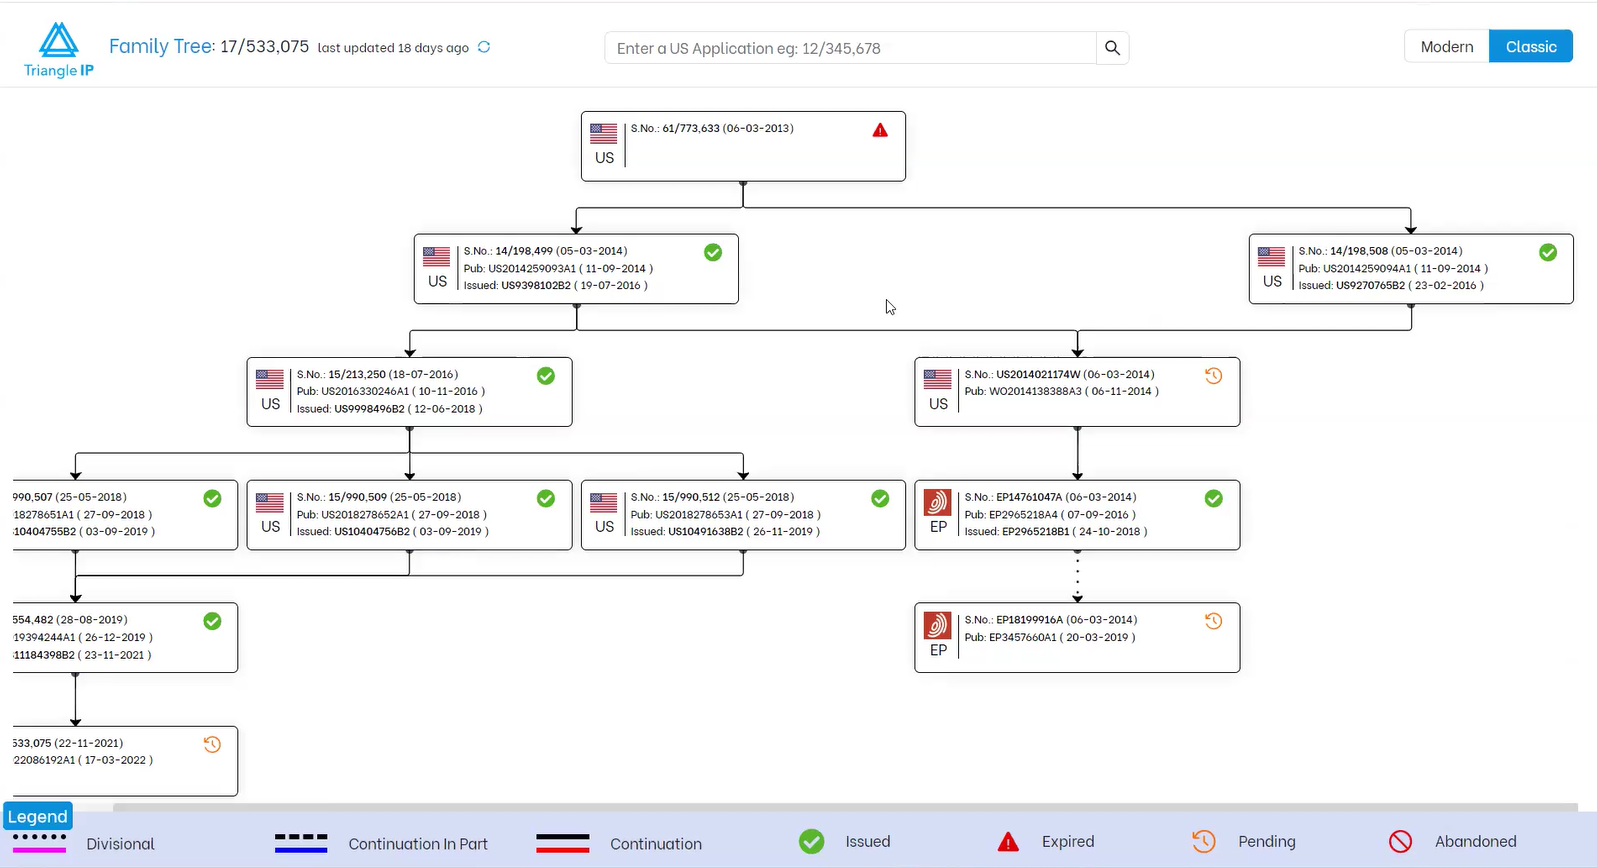
New ‘Classic’ Family Tree Visualization of Patent Portfolios in the TIP ToolTM
#2. Clear Relationship Arrows: The ‘Classic’ view uses arrows to show direct and indirect relationships between patents (represented by rectangular boxes), which is quite difficult to judge in the ‘Modern’ viewing option.
For enhanced clarity, these relationships—divisional, continuation, and continuation-in-part—are represented by three different types of lines: small dotted for divisional, dashed for continuation-in-part, and solid for continuation.
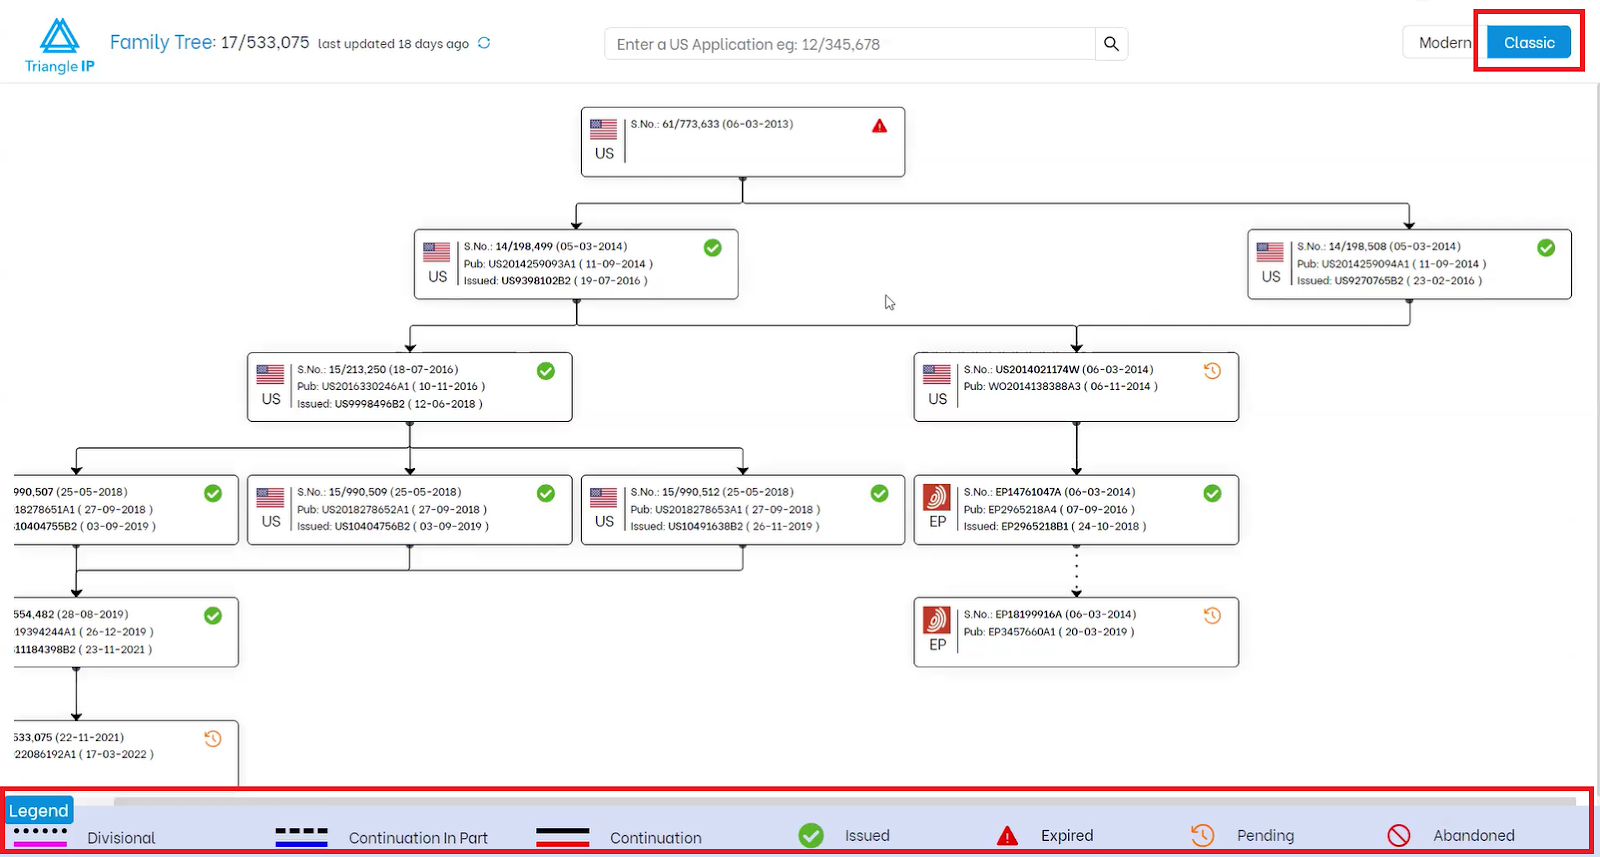
(Note: For a better understanding, refer to the legend at the bottom of the ‘Classic’ view of the Family Tree.)
#3. Color-Coded Status Indicators: The lines we discussed above are also given some color coding to make the relationship identifiable. These colors will appear when you hover over these interconnected lines.
- Pink indicates a divisional relationship.
- Blue denotes continuation in parts.
- Red represents the continuation relationship between parent and child applications.
Additionally, each patent’s status, i.e., issued, pending, expired, is also color-coded for quick identification (Hover over the boxes to check the status).
- Green indicates issued patents
- Gray represents expired patents
- Yellow denotes pending applications

#4. Detailed Application Information: In the Modern view, the boxes contained limited information, only like application number and filing date. Now, with the ‘Classic’ view, there is more information readily accessible.
You can now have the serial number, publication number, and issued date of the application.

Moreover, by clicking on any application, users can get detailed bibliographic information, including the patent number, assignee name, filing date, inventors, and entity type, with additional downloadable PDF and external links in both viewing options.
So that wraps up the latest enhancements we’ve made to the TIP Tool™, designed to make your IP management seamless and more efficient.
Stay Tuned For More
Thank you for joining us on this exploration of the new ‘Classic’ Family Tree Visualization. We’re committed to continuously developing and enhancing the TIP Tool™ to meet your needs and exceed your expectations.
Stay tuned for more updates, and don’t hesitate to reach out with your thoughts, questions, or suggestions. Together, we can make patent mining easy for innovation driven enterprises.
Connect with us—your feedback inspires our innovations!